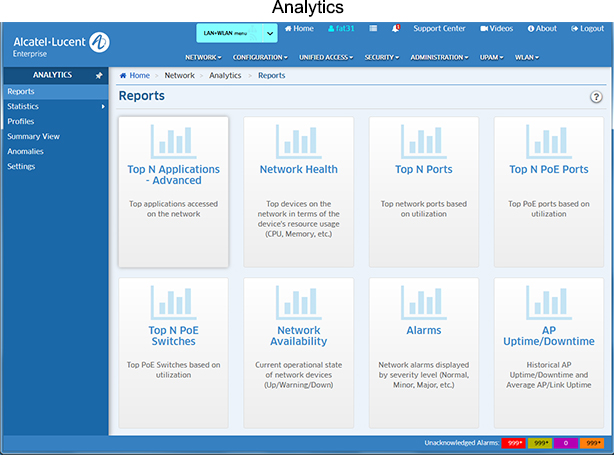
The Analytics Application provides users with a comprehensive view of network resource utilization, including views of users, devices, and applications. The application also provides information on usage trends, including predictive analysis of future network resource utilization. The Reports Screen (shown below) is used to view Analytics Reports and configure how the information is displayed.
Note: Network Health, Top N Ports, Network Availability, and Alarms Reports are supported on all OV Cirrus Devices. Application Visibility Reports (Top N Applications - Advanced) are supported on OS6860E Switches (including a virtual chassis of OS6860/OS6860E Switches where at least one OS6860E is present), and APs.
Note: The Analytics Application provides real-time viewing of Analytics Reports. You can also schedule Analytics Reports to be generated and stored as PDF documents using the Report Application. This way, in addition to real-time viewing in the Analytics Application, you can automatically generate and store Analytics Reports that you can view at any time. Note that users authenticated through an external RADUIS Server can only generate live reports, not scheduled reports. Users authenticated through the Local OmniVista Authentication Server can generate both live and scheduled reports.
The Analytics application provides a "real-time" view of all manged network devices, and can be used to create a Port Utilization Report that displays port utilization by network devices. The following screens are used to view/analyze the network using the Analytics application:
Note: Remember, to generate a Top N Ports Utilization, Top N PoE Ports Utilization, or Top N PoE Switches Report, you must first create an Analytics Profile that defines the switches/ports that you want to view and the type of information that you want to view on those switches/ports. To generate a Top N Applications - Advanced Report, you must first create a Signature Profile in the Application Visibility Application that defines the switches/ports that you want to view and the type of information that you want to view on those switches/ports. Data will only be gathered and displayed for those switches/ports included in the profile. You do not need to create a profile for Network Availability, Alarms, Network Health, or SIP Reports.
The first step in generating analytics information for a Top N Ports Utilization Report is to go to the Profiles Screen and create an Analytics Profile. Analytics information is gathered by creating an Analytics Profile that specifies the information to be viewed and the network switches/ports that will be monitored. Reports will generate data only for those switches/ports included in a profile.
Network Health, Network Availability, and Alarms Reports provide a "real time view" of the network. You do not need to create a profile for these reports. However, to view network alarms (Alarm Report) you must go to the Notifications application and configure traps on the switches you want to monitor. Network alarms will then be displayed on the Alarms Report Screen. (These alarms are also displayed, along with all network alarms, in the Notifications application.)
You can view all Analytics Reports on the applicable report screen. The information in the reports is presented in graphical and linear format, depending on the report type.