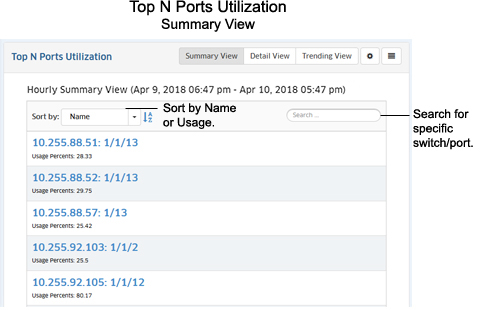
The Analytics Top N Ports Report Screen displays the top network ports based on utilization. By default, the Summary View is displayed (list view). In this view, switches/ports are displayed in a list view from highest to lowest utilization for the configured time period (e.g., day, week). By default, all top switches/ports are displayed. However, there are view options that you can use to view information for specific switches/ports:
The information can be displayed in different formats, and you can also configure the amount of information displayed.
Information can be displayed in a Summary View or a Detail View. The Summary View provides a summary of port traffic for the configured time interval (e.g., last 24 hours). The Detail View displays a subset of the data in a bar chart format. For example, if a report is configured to display data for the last 24 hours, the Summary View will display a summary of the data for the last 24 hours; and the Detail View will then display data for each hour within those 24 hours. The Trending View is used to view predicted future port utilization based on past utilization. Port utilization predictions can be used to predict future usage from past trending patterns and provide valuable insight for capacity management.
Note: Report Views and configuration options are configured using the Options Bar located at the top of the report.
By default, the Summary View is displayed. In this view, switches/ports are displayed in a list view from highest to lowest utilization for the configured time period (e.g., last 24 hours). Utilization for each port is displayed as a percentage of the total utilization for all monitored ports for the configured time period.
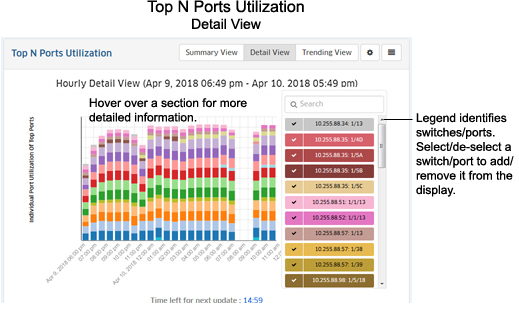
The Detail View displays information in a bar chart view. While the Summary View displays the information for the configured time period (e.g., last 24 hours), this view provides a detailed view of the specified time interval. For example, if the Summary View displays information for the last 24 hours, the Detail View will display information for each hour within those 24 hours.
Depending on the number of ports you configured for display (e.g., top 10 ports, top 15 ports), any monitored ports that qualify during the configure time interval (e.g., last 24 hours) are displayed. Ports are simply stacked numerically in each bar by IP address and port number (the order is not based on utilization). The legend on the right of the screen identifies each switch/port in the chart by color and text. You can hover over a section of the chart to view detailed information for that section. Or you can click on a switch/port in the legend to isolate the switch/port in the display and show the same detailed information. You can also click on the check mark to select/deselect switches/ports in the legend to add/remove them from the display. The example below shows an hourly Detail View for a one day period.
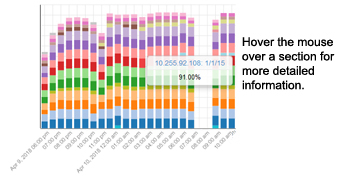
You can hover the mouse over a section of the chart to view the number of flows for that application over the time period displayed (e.g., hour). In the example below, which shows hourly usage, hovering over a section of a bar chart shows switch 10.255.92.106, port 1/1/5 with a utilization of 91% for that hour.
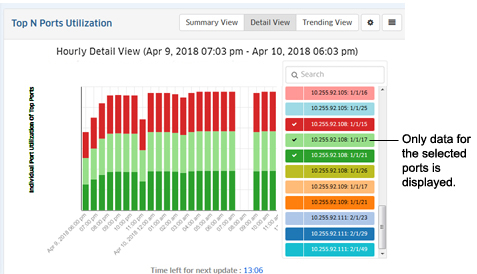
If you want to isolate a port or ports, you can select/deselect the port(s) in the legend.
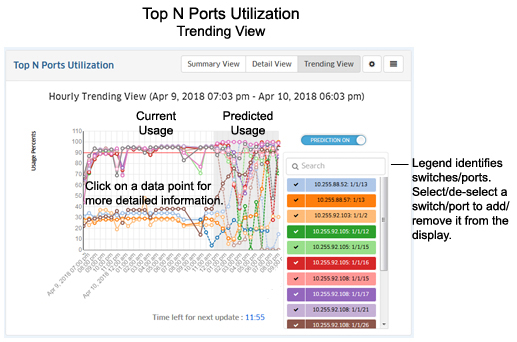
The Trending View is used to view predicted future port utilization based on past utilization. Port utilization predictions can provide valuable insight for capacity management. To make port utilization predictions, OmniVista samples past port utilization for a period of time (Prediction: Training Timeout), and predicts future utilization within a configurable error rate (Prediction: Training Error) using a machine learning algorithm.
To view future trending information, click on the Trending View button and enable the Prediction On slider. When you initially enable the slider, the slider will display "Prediction in progress" while OmniVista samples and learns port utilization rates. The predicted utilization will then appear in the display to the right of the current utilization. The predicted usage area of the display will be slightly shaded to differentiate it from current usage. The amount of predicted data displayed depends on the interval time configured for the report (e.g., last 24 hours, last 7 days). For predicted data, OmniVista will display approximately one-half of the configured interval time, as shown in the table below.
| Configured Time Interval |
Amount of Predicted Data |
Last 24 Hours |
12 Hours |
Last 7 Days |
3 Days |
Last 4 Weeks |
2 Weeks |
If OmniVista is unable to determine future utilization, a message will appear at the top of the display with a link to the reason(s) (e.g., 10.255.225.234: 1/10. Message: Prediction Analytics for port could not be performed due to insufficient data for Training).
The information is displayed in the chart based on the trending configuration settings set in the Trending View Configuration Screen. The screen is also used to set training parameters that OmniVista will use to learn about past/current usage to predict future usage.
As with other reports, the Trending View Configuration Screen is used to configure how information displayed in the report. It is also used to set training parameters that OmniVista will use to learn about past/current usage to predict future usage. Detailed trending parameters are set in the Preferences Application on the Settings Screen. By default, OmniVista will use these parameters to predict future utilization. Any parameters that you configure on this screen will override the parameters configured in the Preferences Application. Click on the Configuration icon on the Trending Screen to bring up the Trending Configuration Screen, then complete the fields as described below.
When you are done, click the Save button. The report display will immediately change to the new view. This will remain the view until it is changed again.
You can configure the amount of information displayed (e.g., the number of ports you want to view) as well as the time period that you want to view. To configure the report display, click on the Configuration icon to bring up the Configuration Screen, then complete the fields as described below to configure the information displayed in the report.
When you are done, click the Save button. The report display will immediately change to the new view. This will remain the view until it is changed again.