The Analytics Statistics Chart Views Screen displays a list of configured View Profiles, which provide graphical and tabular views of collected Statistics data. The screen is used to create, edit, delete, and view collected Statistics data. Click here for an overview of the Statistics application, including setup and basic workflow.
You can create a View Profile from any switch(es) from which you are collecting Statistics data. The View Profile is independent of any specific Collection Profile. As long as OmniVista is collecting statistics from a switch (either through a Collection Profile or enabling statistics on a switch on the Managed Devices Screen), that switch can be included in a View Profile. To create a View Profile, click on the Add icon at the top of the List of View Profiles, complete the fields as described below, then click on the Create button.
Note: You can have a maximum of 50 Counters in a View Profile. If you want to remove a Counter(s) from the Chart, select the Counter(s), click on the Remove Counters button, and click OK at the Confirmation Prompt. The Counter(s) will be moved to the "Available Counters" tab. To add any variables, click on the "Available Counters" tab, select the Counter(s), click on the Add Counters button, and click OK at the Confirmation Prompt.
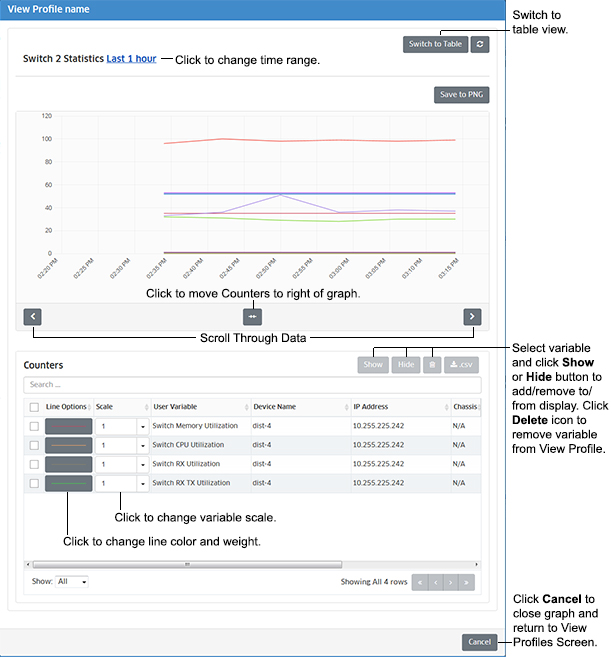
To view statistics data, select a View Profile in the View Profile List and click on the View Statistics button at the top of the list (or just click on the Profile Name). You can only view data for one profile at a time. Data is displayed as a percentage of the maximum capacity for each attribute (0 - 100 %). By default, data is displayed for the last hour. However, you can change the display time range or display more detail within a time range. You can also change the line color/width or scale of a Counter to make it easier to view in the chart.
Note: You can click on the Switch to Table button at the top of the screen to display detailed data in table view. From Table View, you can click on the View Chart button to return to chart view.
Note: Statistics are collected based on a one-hour average for each attribute.
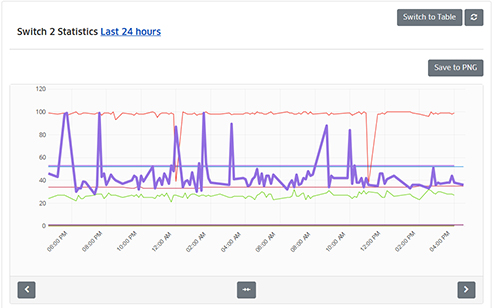
As shown in the example above, the data for the profile (e.g., Switch 2 Statistics) is displayed in a line chart at the top of the screen and the attributes included in the profile are displayed below in the Counters table. (You can click on the button at to bottom of the graph to move the Counters to the right of the graph.) You can use the Counters Table as a legend to view different attributes in the line chart. You can also select an attribute(s) and click on the Show or Hide buttons to add or remove them from the chart. When you hide an attribute, the it will be "grayed out" in the Counters Table. Data will still be collected for the attribute(s), the data will just not be displayed in the chart. Select the hidden attribute(s) and click on the Show button to display the attribute in the chart. You can also select an attribute and click on the Delete icon to remove the it from the View Profile.
Note: OmniVista automatically polls devices in a profile based on the Automatic Polling Interval configured for the profile. However, you can click on the Refresh button above the chart to perform an immediate poll and re-display of the data. You can also click on the Save to PNG button to save/view the chart as a .png file.
By default, data is displayed for the last hour. Click on the time range link (e.g., "last 1 hour") to bring up the Time Range Window. Change the time range as described below and click on the Get Data button.
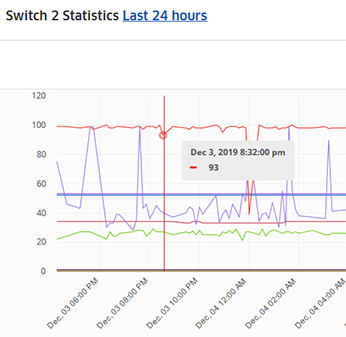
You can place the cursor on an attribute line anywhere along the timeline to view exact data for that attribute at a specific time, as shown below. The data displayed is based on the polling interval configured for the profile. For example, if the polling interval is 60 seconds, data is displayed at one-minute intervals as you move the cursor along the timeline. The line color for the attribute is displayed along with the data. Specific data for each poll is also available in Table View.
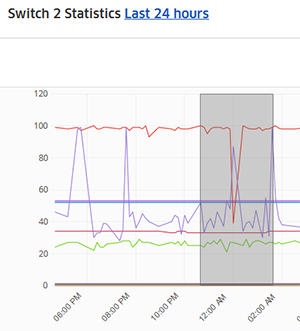
You can also zoom in on a specific period on a time range to view more detail. Click and drag the mouse along the section of the graph that you want to view. The section is highlighted in gray, as shown below.
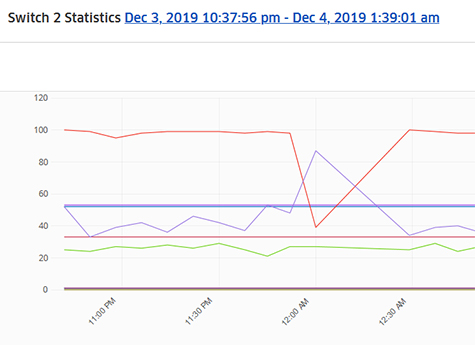
Release the mouse clicker and the time range you selected will be displayed in detail. As you can see, rather than displaying the last hour of data, the graph now displays a detailed view of the selected time range (December 3, 2019 10:37:56 p.m. - December 4, 2019 1:39:01 p.m.)
You can change the color or width of a Counter's line to help you track the Counter more easily. To change a line color or width, click on the line in the Line Options Column of the Counters Table. To change a line width, click on the Line Width drop-down and select a different width. To change the line color, click on Line Color drop-down, choose a different line color, then click on the Choose button. When you are done, click anywhere in the display to close the window. The Counter will be displayed in the chart with the new color and/or width, as shown below.
You can also change the scale used to plot a Counter by clicking on Scale Column and selecting a different scale. By default, all Counters are set to a Scale of 1. When two or more Counters are being graphed simultaneously, the graph line for one Counter may be disproportionately large (or small), making it difficult to view. If this situation occurs, you can select a different scale for that Counter. In this context, scale is really a multiplier. The range of scale values is 0.001 - 1000.
To display data in a detailed table view, click on the Switch to Table button at the top of a profile chart screen. You can only view statistics for one device at a time. Click on the Select a Device button, select a device, then click on OK to display the data. Table View provides detailed information at each data poll. The information is displayed as a percentage of the maximum value for each attribute.
You can only view statistics for one switch at a time. Click on the Select a Device button to view data for a different switch in the profile. Click on the View Chart button to return to chart view.
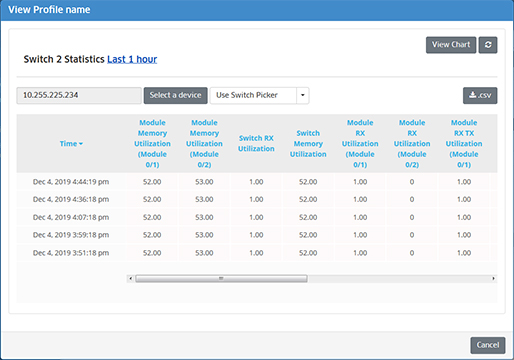
Note: You can click on the .CSV button at the top of the table to view/save the table as a .csv file. The timestamp on the .csv file is the OmniVista Server time.
Click on a profile in the View Profile List and click on the Edit icon. The Edit View Profile Screen will open. Edit any parameters as described above and click on the Apply button. You cannot edit the profile name.
Click on a profile(s) in the View Profile List and click on the Delete icon. Click on OK at the Confirmation Prompt. Note that deleting a profile also deletes all statistical data associated with the profile, and removes the profile widget from the Dashboard Performance Monitoring tab.
The View Profile List displays information for all View Profiles. Click on a Profile Name to view statistics data for the profile. Click on a switch in the Devices Column for detailed information on devices in the profile.