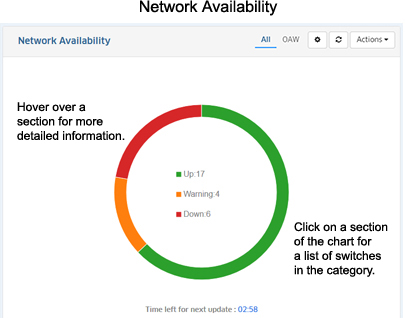
The Analytics Network Availability Screen displays the current operational state of all discovered network devices (Up/Warning/Down). Each category is displayed as a percentage of all monitored switches. You can view information for All devices or just APs. The information can be displayed in different formats, and you can configure the information displayed.
Note: Report Views and configuration options are configured using the Options Bar located at the top of the report. This help page contains view and configuration information specific to Network Availability Reports. For specific information on all of the options available, see the "Report Options" section of the Analytics Reports Help.
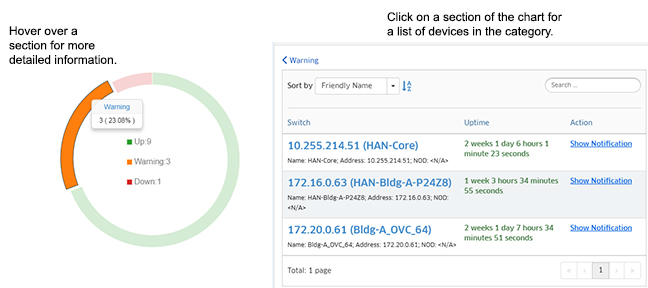
You can view the Network Availability Report in a couple of different ways. Hover the mouse over a category to display a brief summary of the category (the number of switches in the category, along with the percentage of all monitored switches in that category). You can also click on a category to display a list of switches in the category, with specific information about each switch. Click on the "Show Notification" Link to go to the Notifications application and view notifications for the selected device. Click on the "Back" link (<) to return to the default view.
You can configure the refresh rate for the data displayed by clicking on the Configuration icon in the Options Bar to bring up the Configuration Screen. Set the Auto Refresh Timer and click on the Save button. (Range = 1 - 10 minutes).