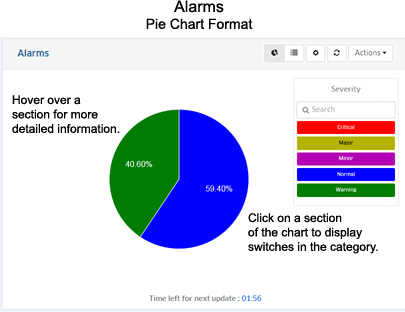
The Analytics Alarms Screen displays network status/traps for all discovered switches. By default, a graphical pie chart view is displayed. The reported alarms in each severity level are displayed as a percentage of the total alarms reported. You can click on a severity level in the pie chart to view the switch(es) from which the alarms originated, and the number of those alarms received, along with the percentage of the total number of alarms received from that switch. In addition, the information can be displayed in different formats, and you can also configure the amount of information displayed.
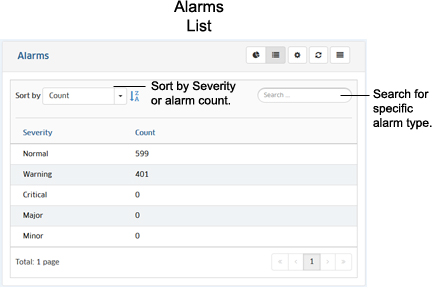
You can view the Alarms Report in a number of ways. By default, the pie chart format is displayed. You can also view a list of all alarms.
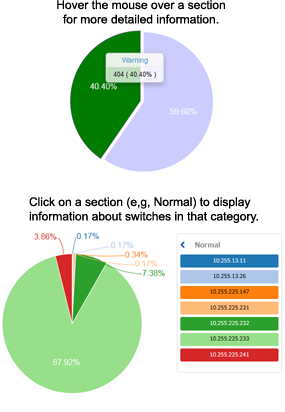
By default, the pie chart view is displayed. The reported alarms in each severity level are displayed as a percentage of the total alarms reported. You can hover over a section of the chart for more details about the alarm category, or click on a section in the pie chart to view the switch(es) from which the alarms for that category originated.
Hover over a section of the pie chart to display the number of alarms generated for that category. Click on a section of the chart to view information about the switches generating the alarms for that category (the legend will change from Severity Level categories to identify the switches. You can then hover over a section to display detailed information for a specific switch. Click on the Back Arrow (<) above the legend to return to the default view.
The list format displays the exact alarm count for each severity level. By default, the list is displayed by alarm count; however you can select "Severity" in the Sort by drop-down menu to display the applications by sample count. You can also search for and display a specific severity level by entering the name in the Search field.
You can configure the amount of information displayed (e.g., refresh timer). To configure the display, click on the Configuration icon to bring up the Configuration Screen, then complete the fields as described below to configure the information displayed in the report.
When you are done, click the Save button. The report display will immediately change to the new view. This will remain the view until it is changed again.