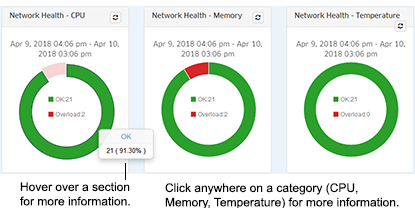
The Analytics Network Health Report Screen displays the health of all discovered network devices in terms of CPU, Memory, Temperature. The widgets on the page provide a status overview for all network devices for each health category. Hover over an area in the widget for more information. Click on a widget to bring up an overview screen for a specific health category (CPU, Memory, Temperature), where you can view detailed information on each network device and set health thresholds for devices.
In addition, the information can be displayed in different views, and you can also configure the amount of information displayed. Report Views and configuration options are configured using the Options Bar located at the top of the report. This help page contains view and configuration information specific to Network Health Reports. For specific information on all of the options available, see the "Report Options" section of the Analytics Reports Help.
The main Network Health Screen provides a status overview for all network devices for each health category (CPU, Memory, Temperature). Each category displays an overview of the number of devices over threshold (Overload) and within threshold (OK). Hover over a section in the widget for more information. Click on a widget to go the an overview page for a health category (e.g., CPU, Memory, Temperature). From there, you can view a detailed list of devices in each health state (Overload/OK), and set thresholds for each Health Category.
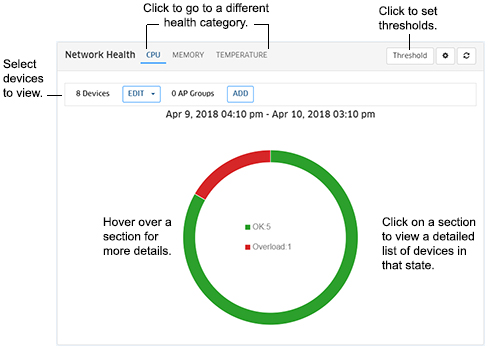
Click on a Health Category on the overview page to view more detailed information for that category (e.g., CPU). Click on the Devices or AP Groups ADD button and select the devices you want to view. Click on the EDIT buton to select different devices. Hover over a section for more information on that state (Overload, OK). Click on a section to view a detailed list of devices in that state. You can also click on the Threshold button to set device thresholds for the Health Category.
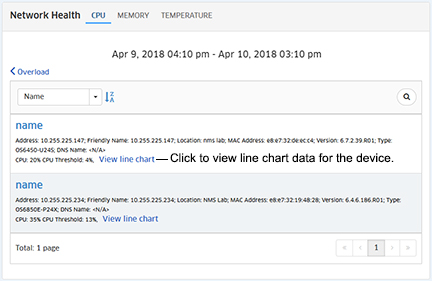
Click on a section of the graphic (e.g., Overload, OK) to display detailed information for all selected devices in that state (e.g., Overload). The screen displays detailed device information. You can also click on the "View line chart link" to display a line chart view of the data for the configured time period.
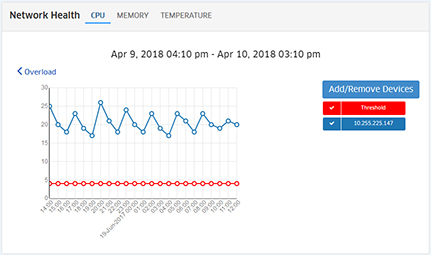
Click on the Add/Remove Devices button above the legend to add/remove devices to/from the display. You can view information for up to 20 devices.
You can configure health thresholds for any discovered device. Health Thresholds are used to set limits for health traps. If a device has been configured to send health traps, a trap will be sent whenever a monitored item's current threshold exceeds the configured health threshold.
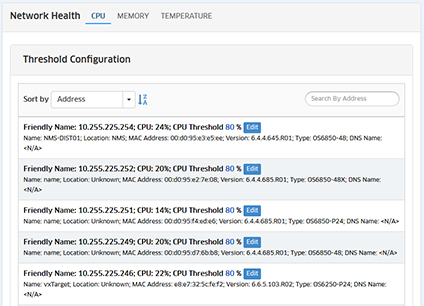
From the overview screen, click on the Configure Health Thresholds button to view and set thresholds for the Health Category for selected devices. If necessary, click on the Devices or AP Groups ADD or EDIT buttons to add/remove selected devices. Threshold information for all selected devices is displayed. To edit a threshold for a specific device, click on the Edit button next to the device and change the threshold. Repeat to change the threshold for any additional devices. When you are finished, click on the Save button.
Note: You can only configure health thresholds for up to 20 devices at a time (including AOS Devices and Stellar APs.) If you select more than 20 devices, the Configure Health Thresholds button will not activate. You can configure health thresholds for more than 20 devices, but you must configure them in groups of 20 (select and configure 20 devices, select and configure an additional 20 devices, etc.).
Note: APs do not support or display Temperature information. Also note that you can only configure the Temperature Threshold on AOS 6.x devices. The Temperature Threshold is hard-coded on AOS 8.x devices and cannot be configured. Also note that changes made to health thresholds will not appear until the next polling cycle (up to an hour).
You can configure the amount of information displayed. To configure the report display, click on the Configuration icon at the top of one of the Health Threshold Catetory overview screens to bring up the Configuration Screen, then complete the fields as described below to configure the information displayed in the report.
When you are done, click the Save button. The report display will immediately change to the new view. This will remain the view until it is changed again.