The Analytics Top N PoE Switches Utilization Report Screen displays PoE utilization by switch. By default, the Pie Chart View is displayed. In this view, switches are displayed in a pie chart with the total amount of PoE power each switch is using based on the total number of switches being displayed (e.g., Top 5, Top 10). By default, data from all switches are selected for display. However, there are view options that you can use to view information for specific switches:
The information can be displayed in different formats, and you can also configure the amount of information displayed.
To generate a Top N PoE Switches Utilization Report, you must first create a Top N PoE Ports Utilization Profile using the Profile Screen. The profile is used to define the switches that you want to view (all ports on the selected switches are included in the report). Note that utilization must be greater than 0% before data is displayed for the switch.
Important Note: A Top PoE Switches Utilization Report can be generated for any PoE-enabled switch. PoE must be enabled on switches/ports to generate PoE Port Utilization data. PoE is enabled and configured on switches/ports using the CLI. See the applicable OmniSwitch CLI Reference Guide for more information.
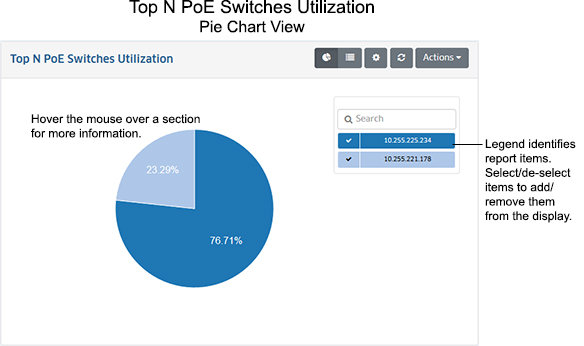
The Top N PoE Switches Utilization Report can be displayed in a Pie Chart View or a List View. In the Pie Chart View, switches are displayed in a pie chart with the total amount of PoE power each switch is using based on the total number of switches being displayed (e.g., Top 5, Top 10).
Note: Report Views and configuration options are configured using the Options Bar located at the top of the report. This help page contains view and configuration information specific to Top N Ports Utilization Reports. For specific information on all of the options available, see the "Report Options" section of the Analytics Reports Help.
The Pie Chart View is displayed by default. In this view, switches are displayed in a pie chart with the total amount of PoE power each switch is using based on the total number of switches being displayed (e.g., Top 5, Top 10). In the example below, two switches are displayed, 10.255.225.234 and 10.255.221.178. Switch 10.255.225.234 is using 76.71% of the total power available for both switches. Switch 10.255.221.178 is using 23.29%.
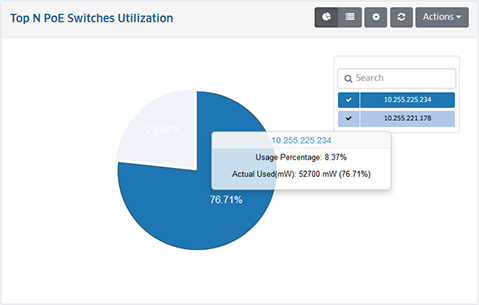
Hover over a section of the chart to display more detailed information. The "Usage Percentage" is the percentage of total PoE power available on the switch that is currently being used. In the example below, Switch 10.255.225.234 is using 8.3% of the total PoE power available on the switch. The "Actual Used" shows the total mW (52,700) being used by the switch, and the percentage of the total power available for both switches.
Click on the List icon at the top of the chart to display switches in List View. By default, switches are displayed in a list view from lowest to highest PoE utilization d as a percentage of the total PoE utilization for all displayed switches (e.g., Top 5, Top 10) for the configured time period (e.g., last 24 hours). You can click on the Sort arrow to sort the switches from highest to lowest.
You can configure the amount of information displayed (e.g., the number of ports you want to view) as well as the time period that you want to view. To configure the report display, click on the Configuration icon to bring up the Configuration Screen, then complete the fields as described below to configure the information displayed in the report.
When you are done, click the Save button. The report display will immediately change to the new view. This will remain the view until it is changed again.