The Analytics Top N PoE Ports Utilization Report Screen displays the top network PoE ports based on the percentage of allocated power being utilized by each PoE Port. You can use the report to determine ports that may be drawing more power than anticipated. For example, if you configure a port's maximum power assuming that a low-power device would be connected to the port but an endpoint device that draws more power is connected, the port's PoE utilization will be 100%. Once you determine which PoE Ports are drawing more power than anticipated based on a Top N PoE Ports Utilization Report, you can use the Locator application to determine what devices are connected to those ports and make any necessary configuration adjustments.
By default, the Detail View is displayed (Bar Chart). In this view, switches/ports are displayed in a bar chart from highest to lowest utilization for the configured time period (e.g., day, week).By default, data from all switches are selected for display. However, there are view options that you can use to view information for specific switches/ports:
The information can be displayed in different formats, and you can also configure the amount of information displayed.
To generate a Top N PoE Ports Utilization Report, you must first create a Top N PoE Ports Utilization Profile using the Profile Screen. The profile defines the switches that you want to view (all ports on the selected switches are included in the report). Note that utilization must be greater than 0% before data is displayed for the port.
Important Note: A Top PoE Ports Utilization Report can be generated for any PoE-enabled switch. PoE must be enabled on switches/ports to generate PoE Port Utilization data. PoE is enabled and configured on switches/ports using the CLI. See the applicable OmniSwitch CLI Reference Guide for more information.
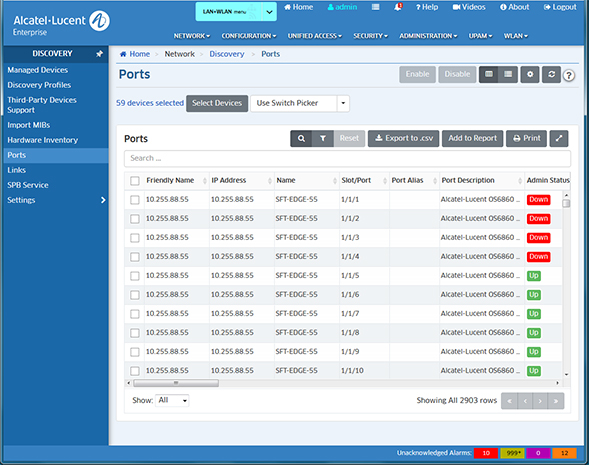
The Top N Ports Utilization can be displayed in a Detail View, Trending, or Tabular View. The Detail View provides PoE port utilization for the configured time interval (e.g., last 24 hours) in a bar chart format. The Trending View displays PoE port utilization for each port in a line chart for the configured time interval. The Tabular View brings up the Discovery Ports Screen, and provides detailed port information (including PoE information) for all ports included in the Profile.
Note: Report Views and configuration options are configured using the Options Bar located at the top of the report. This help page contains view and configuration information specific to Top N PoE Ports Utilization Reports. For specific information on all of the options available, see the "Report Options" section of the Analytics Reports Help.
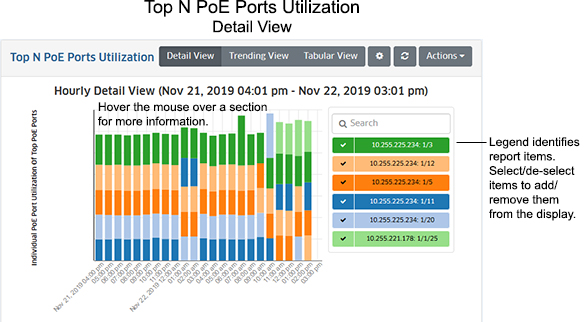
The Detail View provides a bar chart view of the specified time interval (e.g., last 24 hours). Depending on the number of switches/ports you configured for display (e.g., top 5 ports, top 10 ports), any monitored ports that qualify during the specified time interval are displayed. Ports are stacked from highest to lowest utilization. The legend on the right of the screen identifies each switch/port in the chart by color and text.
You can hover over a section of the chart to view detailed information for that section. You can also click the checkmark to select/deselect a switches/ports in the legend to add/remove them from the display. Or you can click on a switch/port in the legend to isolate the switch/port in the display and show the same detailed information. The example below shows an hourly Detail View for a one-day period.
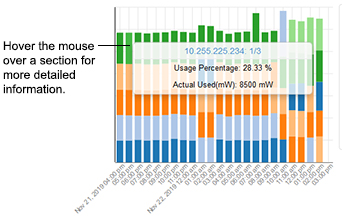
Hover the mouse over a section of the chart to view the detailed utilization information about a port. In the example below, which shows hourly usage, hovering over a section of a bar chart shows port 1/3 on switch 10.255.225.234 with a PoE utilization of 28.33% (8,500 mW) of the total power available for that port for that hour.
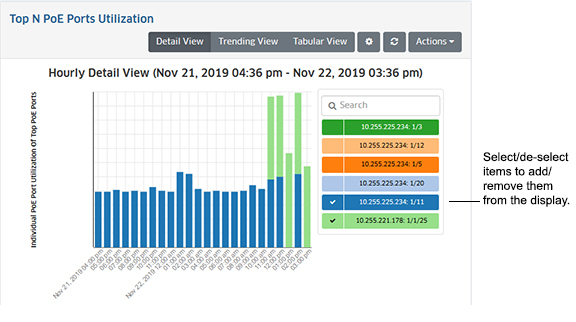
If you want to view specific ports, you can select/deselect the port(s) in the legend.
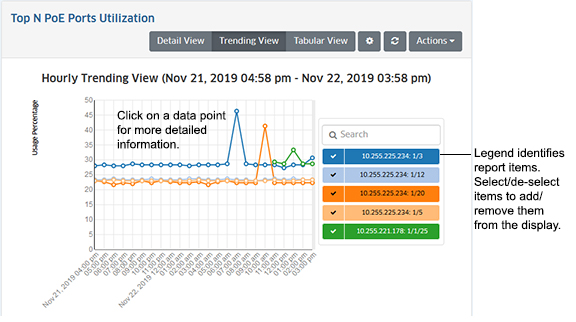
The Trending View provides a bar chart view of the specified time interval (e.g., last 24 hours). Depending on the number of switches/ports you configured for display (e.g., top 5 ports, top 10 ports), any monitored ports that qualify during the specified time interval are displayed.
You can hover over a section of the chart to view detailed information for that section. You can also click the checkmark to select/deselect a switches/ports in the legend to add/remove them from the display. Or you can click on a switch/port in the legend to isolate the switch/port in the display and show the same detailed information. The example below shows an hourly Detail View for a one-day period.
Clicking on the Tabular View button takes you to the Ports Screen (Network - Discovery - Ports), where you can view detailed port information for all network switches.
You can configure the amount of information displayed (e.g., the number of ports you want to view) as well as the time period that you want to view. To configure the report display, click on the Configuration icon to bring up the Configuration Screen, then complete the fields as described below to configure the information displayed in the report.
When you are done, click the Save button. The report display will immediately change to the new view. This will remain the view until it is changed again.