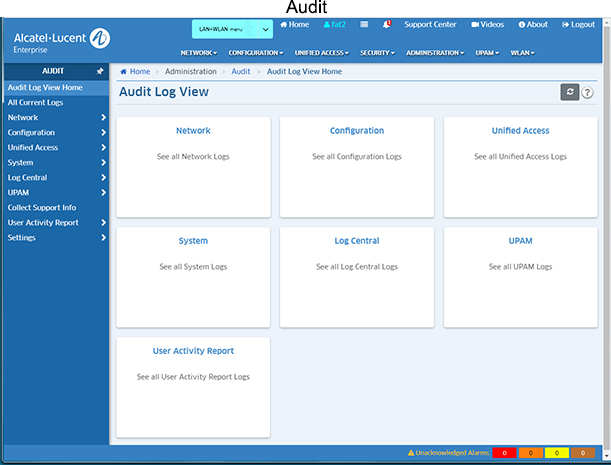
The Audit application is used to monitor client and server activity, such as the date and time when a user logged into OmniVista, when an item was added to the discovery database, when a configuration file was saved, or when a particular application was launched. The information is contained in log files, which are organized by type (e.g., Network, Configuration), as shown on the Audit Home Page below.
The application enables you to view log files, search through log files, and download files. You can view current log files or historical log files that have been archived by OmniVista. Log Files are archived based on preferences configured on the Audit Settings Screen.
Note: You can also click on the Collect Support Info link in the tree to collect log log files from a network device that can be sent to Technical Support to troubleshoot problems.
You can click on one of the tiles on the home page to view the log files in a category (e.g., Network, Configuration), or you can click on a category on the left side of the screen to display a list of log files in the category. Click on a log file to display the contents of the file. The log files in each category are listed below.
Note: Click on the "All Current Logs" link on the left side of the home page to display a list of all current logs. You can then click on a log to display the contents.
Network |
Configuration |
Unified Access |
Analytics Predictive Service Analytics Service Analytics Service Worker AV Audit Service AV Auto-Update AV Service Call Home Service Discovery Discovery Lite NG Discovery Polling Statistics Trap Config Traps WMA |
CLI Scripting Policy Resource Manager Resource Manager Client Service Resource Manager Config Resource Manager Schedule Bakup Info VLAN Creation Result VLAN Deletion Result VLAN Service VLAN Service Worker |
Access Guardian 2.0 Access Guardian 2.0 Polling |
| System | Log Central | UPAM |
Poller Service OV 2500 Server OV Client Scheduler Service Syslog Tomcat Local Host Access Log Tomcat OV Report Tomcat OV Web Worker Poller Service |
Log Central
|
Jetty Jetty Portal Jetty Sponsor Radius UPAM |
| User Activity Report | ||
User Activity Report |
Note: The Log Central link displays the ngnms.log file. This file includes log entries from all log files in real time, with the most recent entries at the top of the file. You can scroll through the file using the scroll bar and arrows on the right side of the screen, or you can also search by keyword. Enter the search criteria in the "Search in this page" field at the top of the log file and click on the Search Next button. The word or phrase is highlighted in yellow throughout the file. You can scroll through the file or click on the Search Next or Search Previous buttons to search through the file. Click on the Cancel Search icon at the top of the table to cancel the search.
You can also create and apply a filter to display specific log entries only. Click on the Filter icon to bring up the Filter Selection window. Select an existing filter and click on the Apply button to apply the filter to the current display. You can also click on the Add icon to create a new filter. Enter a Filter Name and Filter Description, set the conditions for the filter and click on the Add button. Then select the filter to apply it to the current display. Click on the Reset button to cancel the filter and return to the unfiltered view of the file.
Click on the Current button (default) to display the contents of the current file. Click on the Historical button to display all ngnms.log file information, including archived files. Click on the Browse All button to view a list of all archived ngnms.log Files. Click on a file in the list to display the contents of the file. Click on the Download button at the top of the screen to save the file to your computer. Click on the Refresh icon to refresh the display with the most recent log entries.
Note: The User Activity Report displays all
By default, when you click on a log file (e.g., discovery.log, polling.log) the most current log entries are displayed. This "current" view is determined by the settings you configure on the Settings Screen. Once the number of entries reaches the configured number, the log file is archived with the current date and stored in OmniVista. When viewing a log file, the Audit application enables you to view the contents of the current selected log file, view the contents of all log files (current and archived) for the selected log file, or a view list of archived files, which you can then open and view.
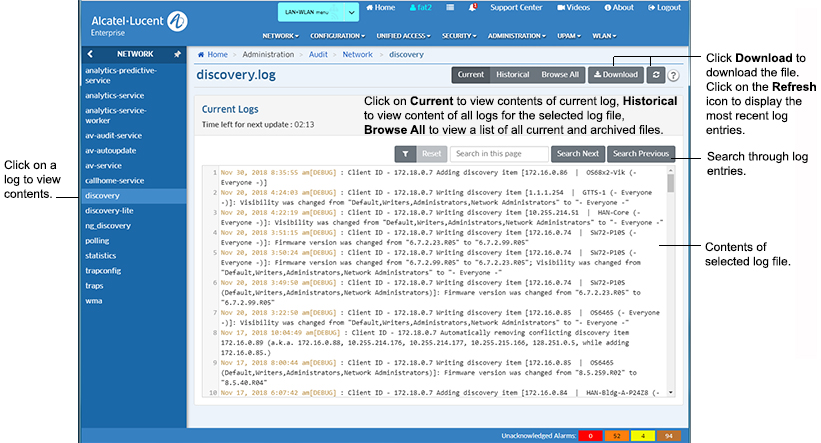
To view a log file, click on a log file type the Home Page (e.g., Network, Configuration), or click on a log file type on the left side of the screen to display the list of log files for that type. Click on a log file (e.g., discovery.log, polling.log) to display the contents of the file. By default, the contents of the most current log file are displayed. This "current" view will display all of the contents that have not been archived. To view the contents of all log files for the selected log file (current and archived) click on the Historical button at the top of the screen.
To view a list of all log files (current and archived), click on the Browse All button at the top of the screen. A list of all log files for the selected log is displayed. The current log file is displayed at the top (e.g., polling.log) followed by all of the archived log files, identified by the date and time the file was archived (e.g., polling_04-29-2016_061727PM.rou). Click on a log file to display the contents of the file.
You can also download the contents of any log file you are viewing by clicking on the Download button at the top of the screen. The contents of the file can then be saved to your computer. Click on the Refresh icon to refresh the display with the most recent log entries.
You can scroll through the contents of a log file using the scroll bar and arrows on the right side of the screen. You can also search a log file by keyword. Enter the search criteria in the "Search in this page" field at the top of the log file and click on the Search Next button. The word or phrase is highlighted in yellow throughout the file. You can scroll through the file or click on the Search Next or Search Previous buttons to search through the file. Click on the Cancel Search icon at the top of the table to cancel the search.
You can create and apply a filter to display specific log entries only. Click on the Filter icon to bring up the Filter Selection window. Select an existing filter and click on the Apply button to apply the filter to the current display. You can also click on the Add icon to create a new filter. Enter a Filter Name and Filter Description, set the conditions for the filter and click on the Add button. Then select the filter to apply it to the current display. Click on the Reset button to cancel the filter and return to the unfiltered view of the file.
You can download the contents of any log file you view by clicking on the Download button at the top of the screen. The contents of the log file will be downloaded as a text file that can be opened with any text editor.